Network Analysis and Visualization
An aspect of Profiles RNS that distinguishes it from other research collaboration tools is its built-in ability to analyze and visualize networks in novel ways. Centrality calculations commonly used in bibliometric and social network analysis, such as "degree" and "closeness", determine a person, department, or institution's position within the research community. Profiles RNS uses this to supplement traditional measures of academic success like number of publications and citation counts.
Network Visualization Gallery
Click any image below to go directly to that page on the Harvard Catalyst Profile website, where you can interact with the visualization.
|
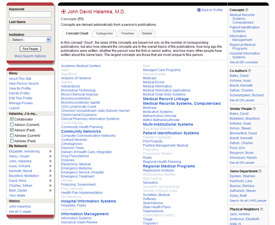
Concept "clouds" emphasize keywords that make a person's research unique.
|
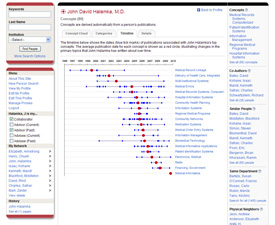
Network timelines show how a person's keywords have changed over time.
|
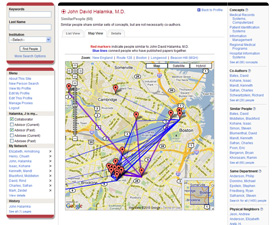
Geographic maps illustrate where similar people are located.
|
|
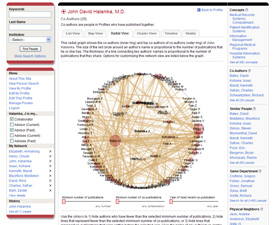
Radial graphs present "ego-centric" views of collaborations.
|
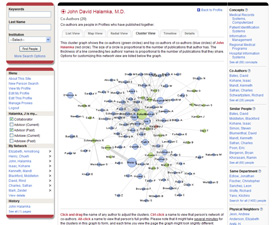
Co-author cluster graphs reveal how teams form and interact.
|
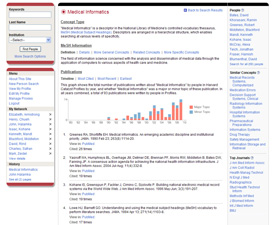
Concept profiles create a view of an institution's strengths.
|


